- Science
- Earth Observatory
- Arctic Sea Ice Shrinks to Its…
- Earth
- Earth Observatory
- Image of the Day
- EO Explorer
- Topics
- More Content
- About
- Search
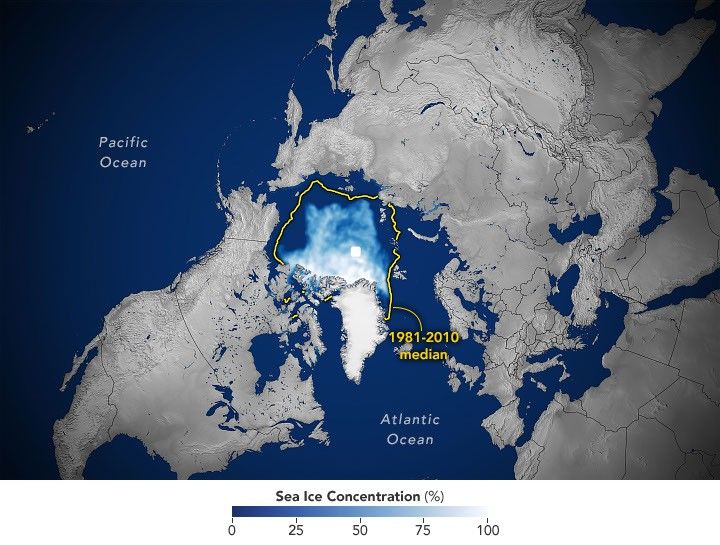
NASA Earth Observatory/Michala Garrison
This story is an update to the Arctic sea ice feature in our World of Change series, which tracks long-term change on Earth’s surface through satellite imagery.
A layer of frozen seawater caps the Arctic Ocean. This sea ice grows through the long polar winter, usually peaking in March, then melts through the summer to its annual low in September. It is a natural fluctuation that has persisted for millennia. But satellite records show the ice now covers less of the Arctic Ocean at its annual maximum and minimum than it did a few decades ago.
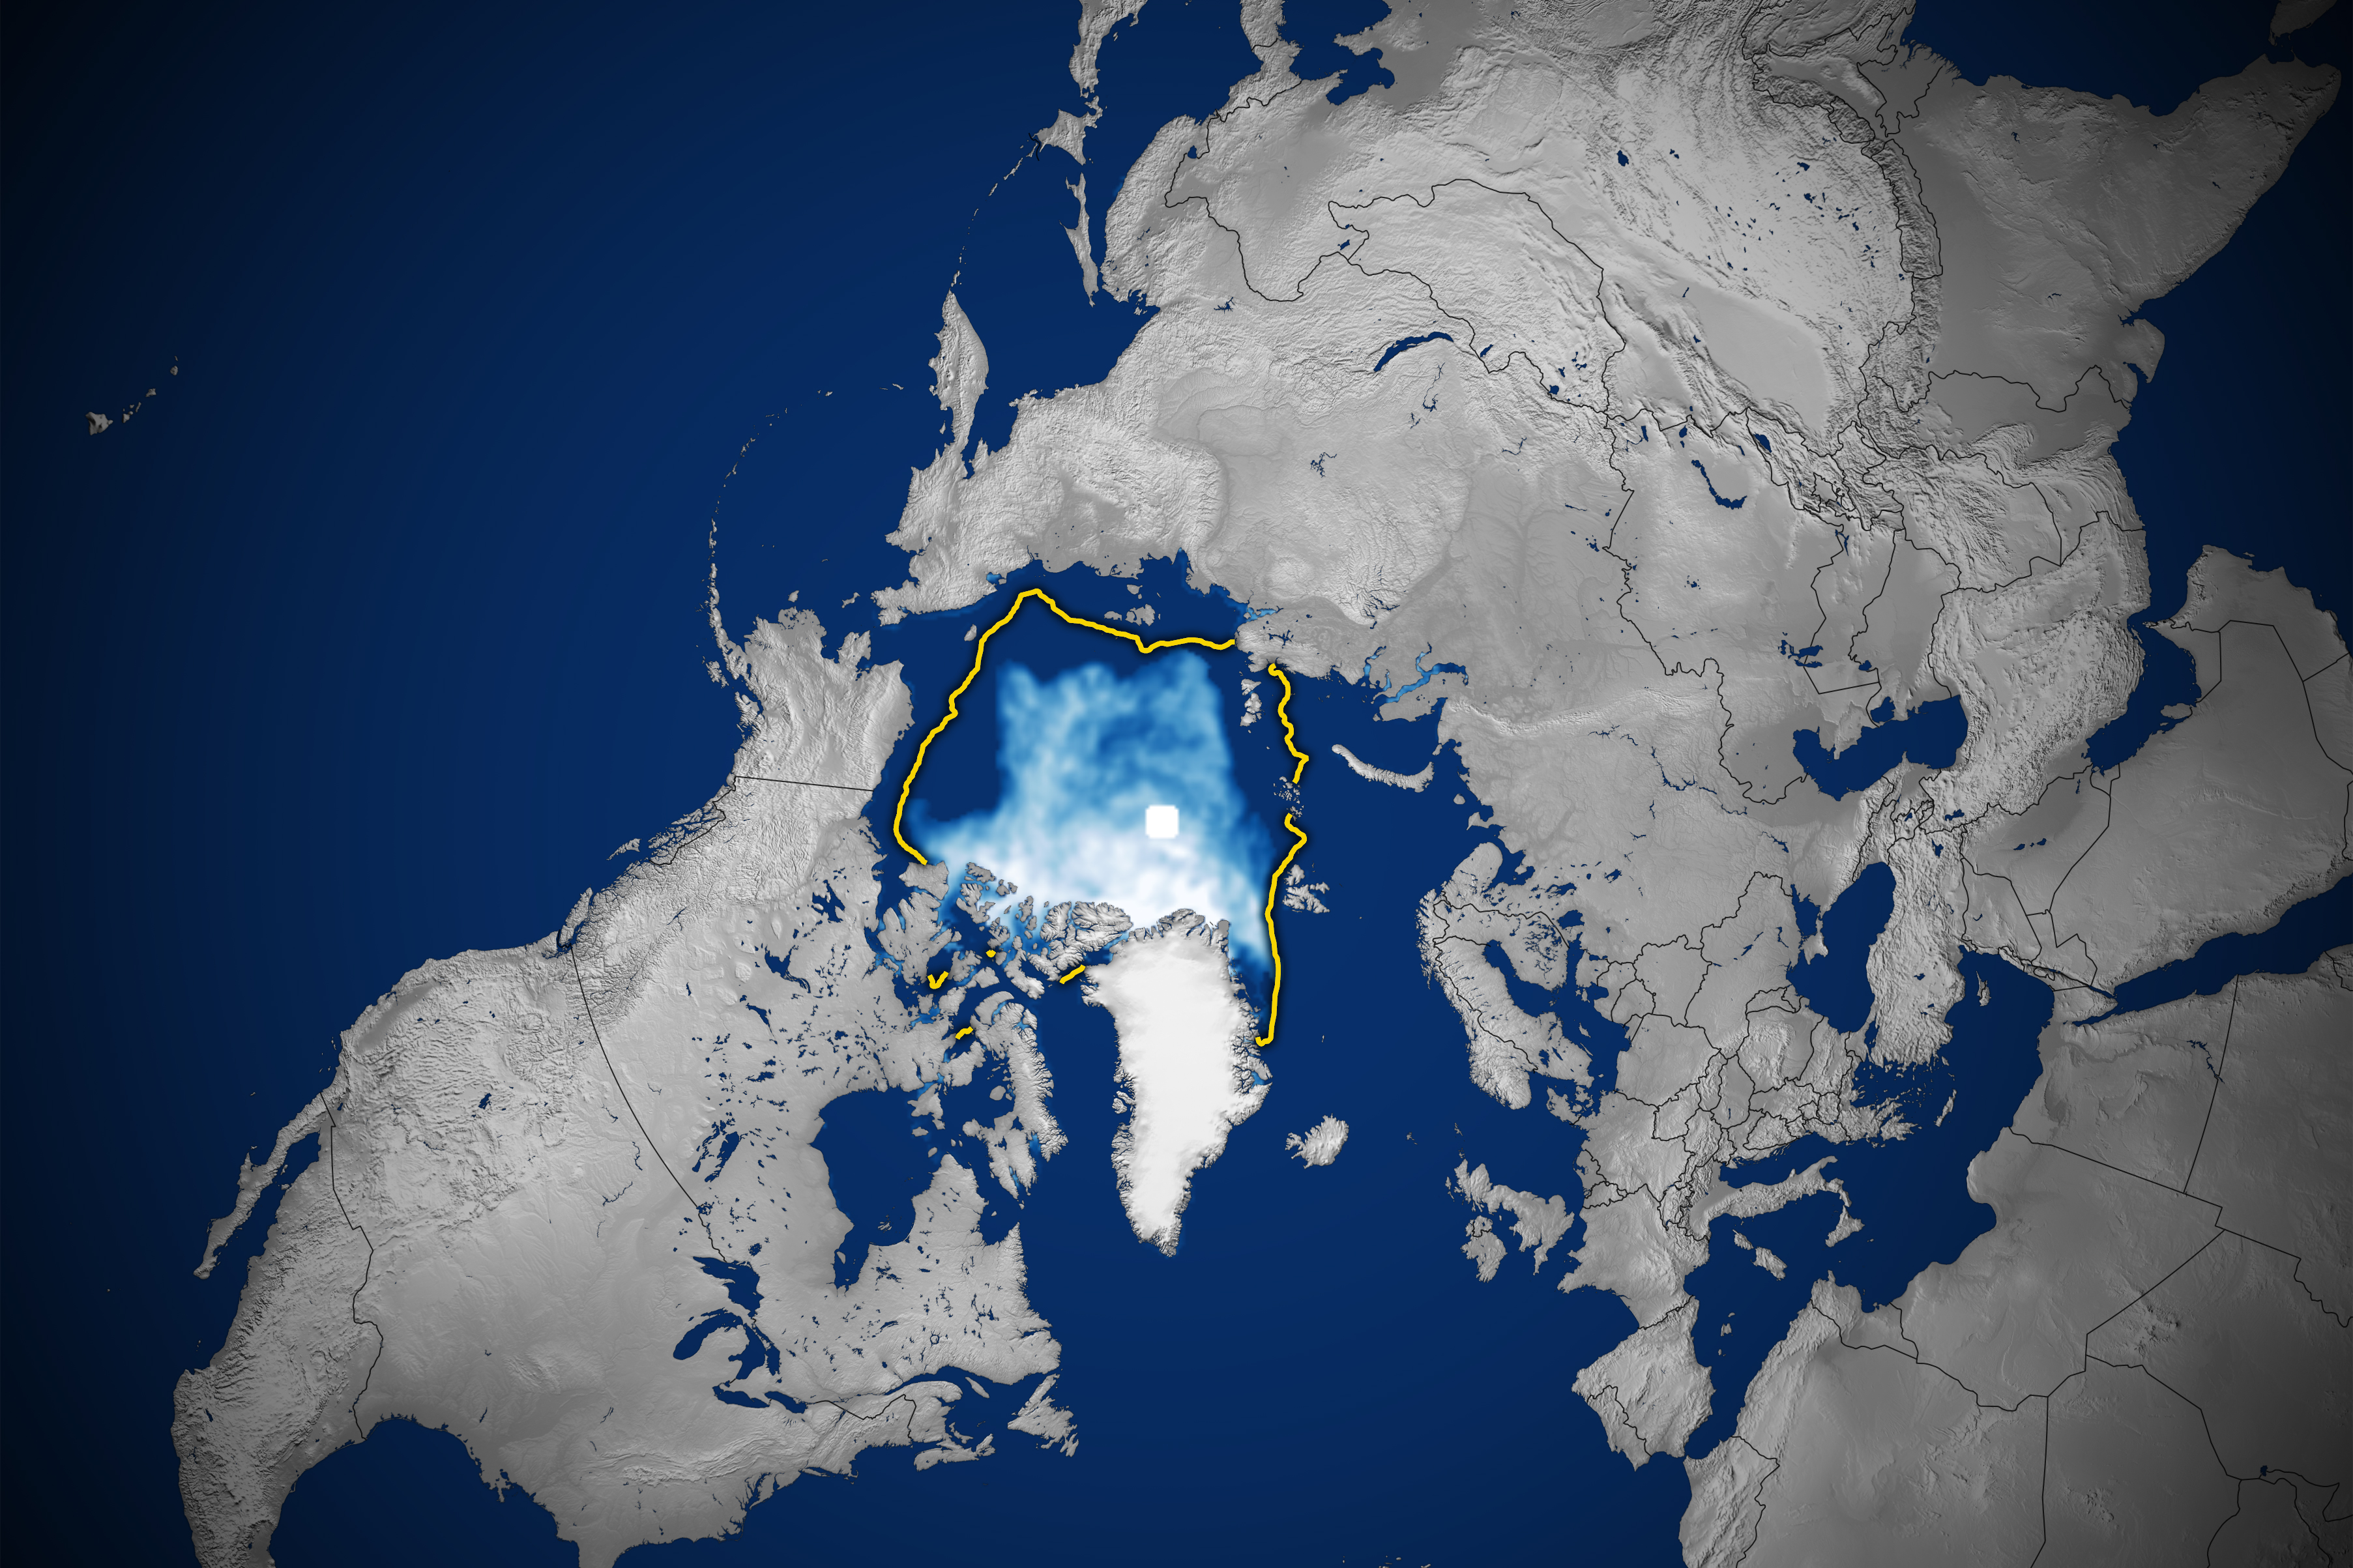
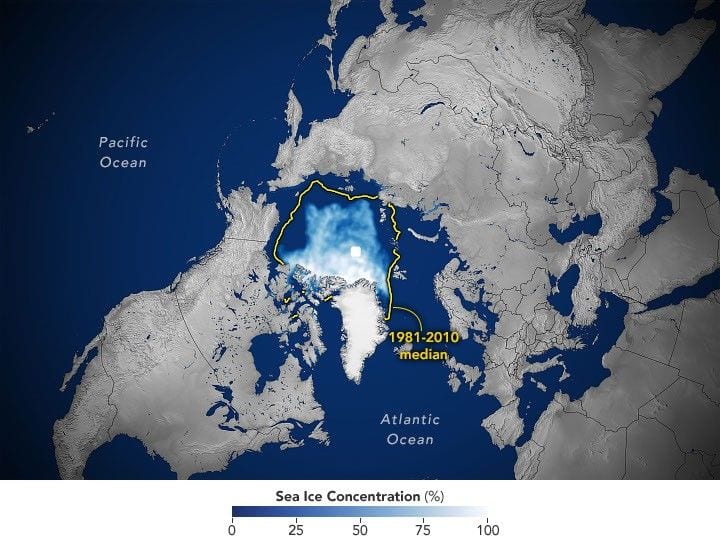
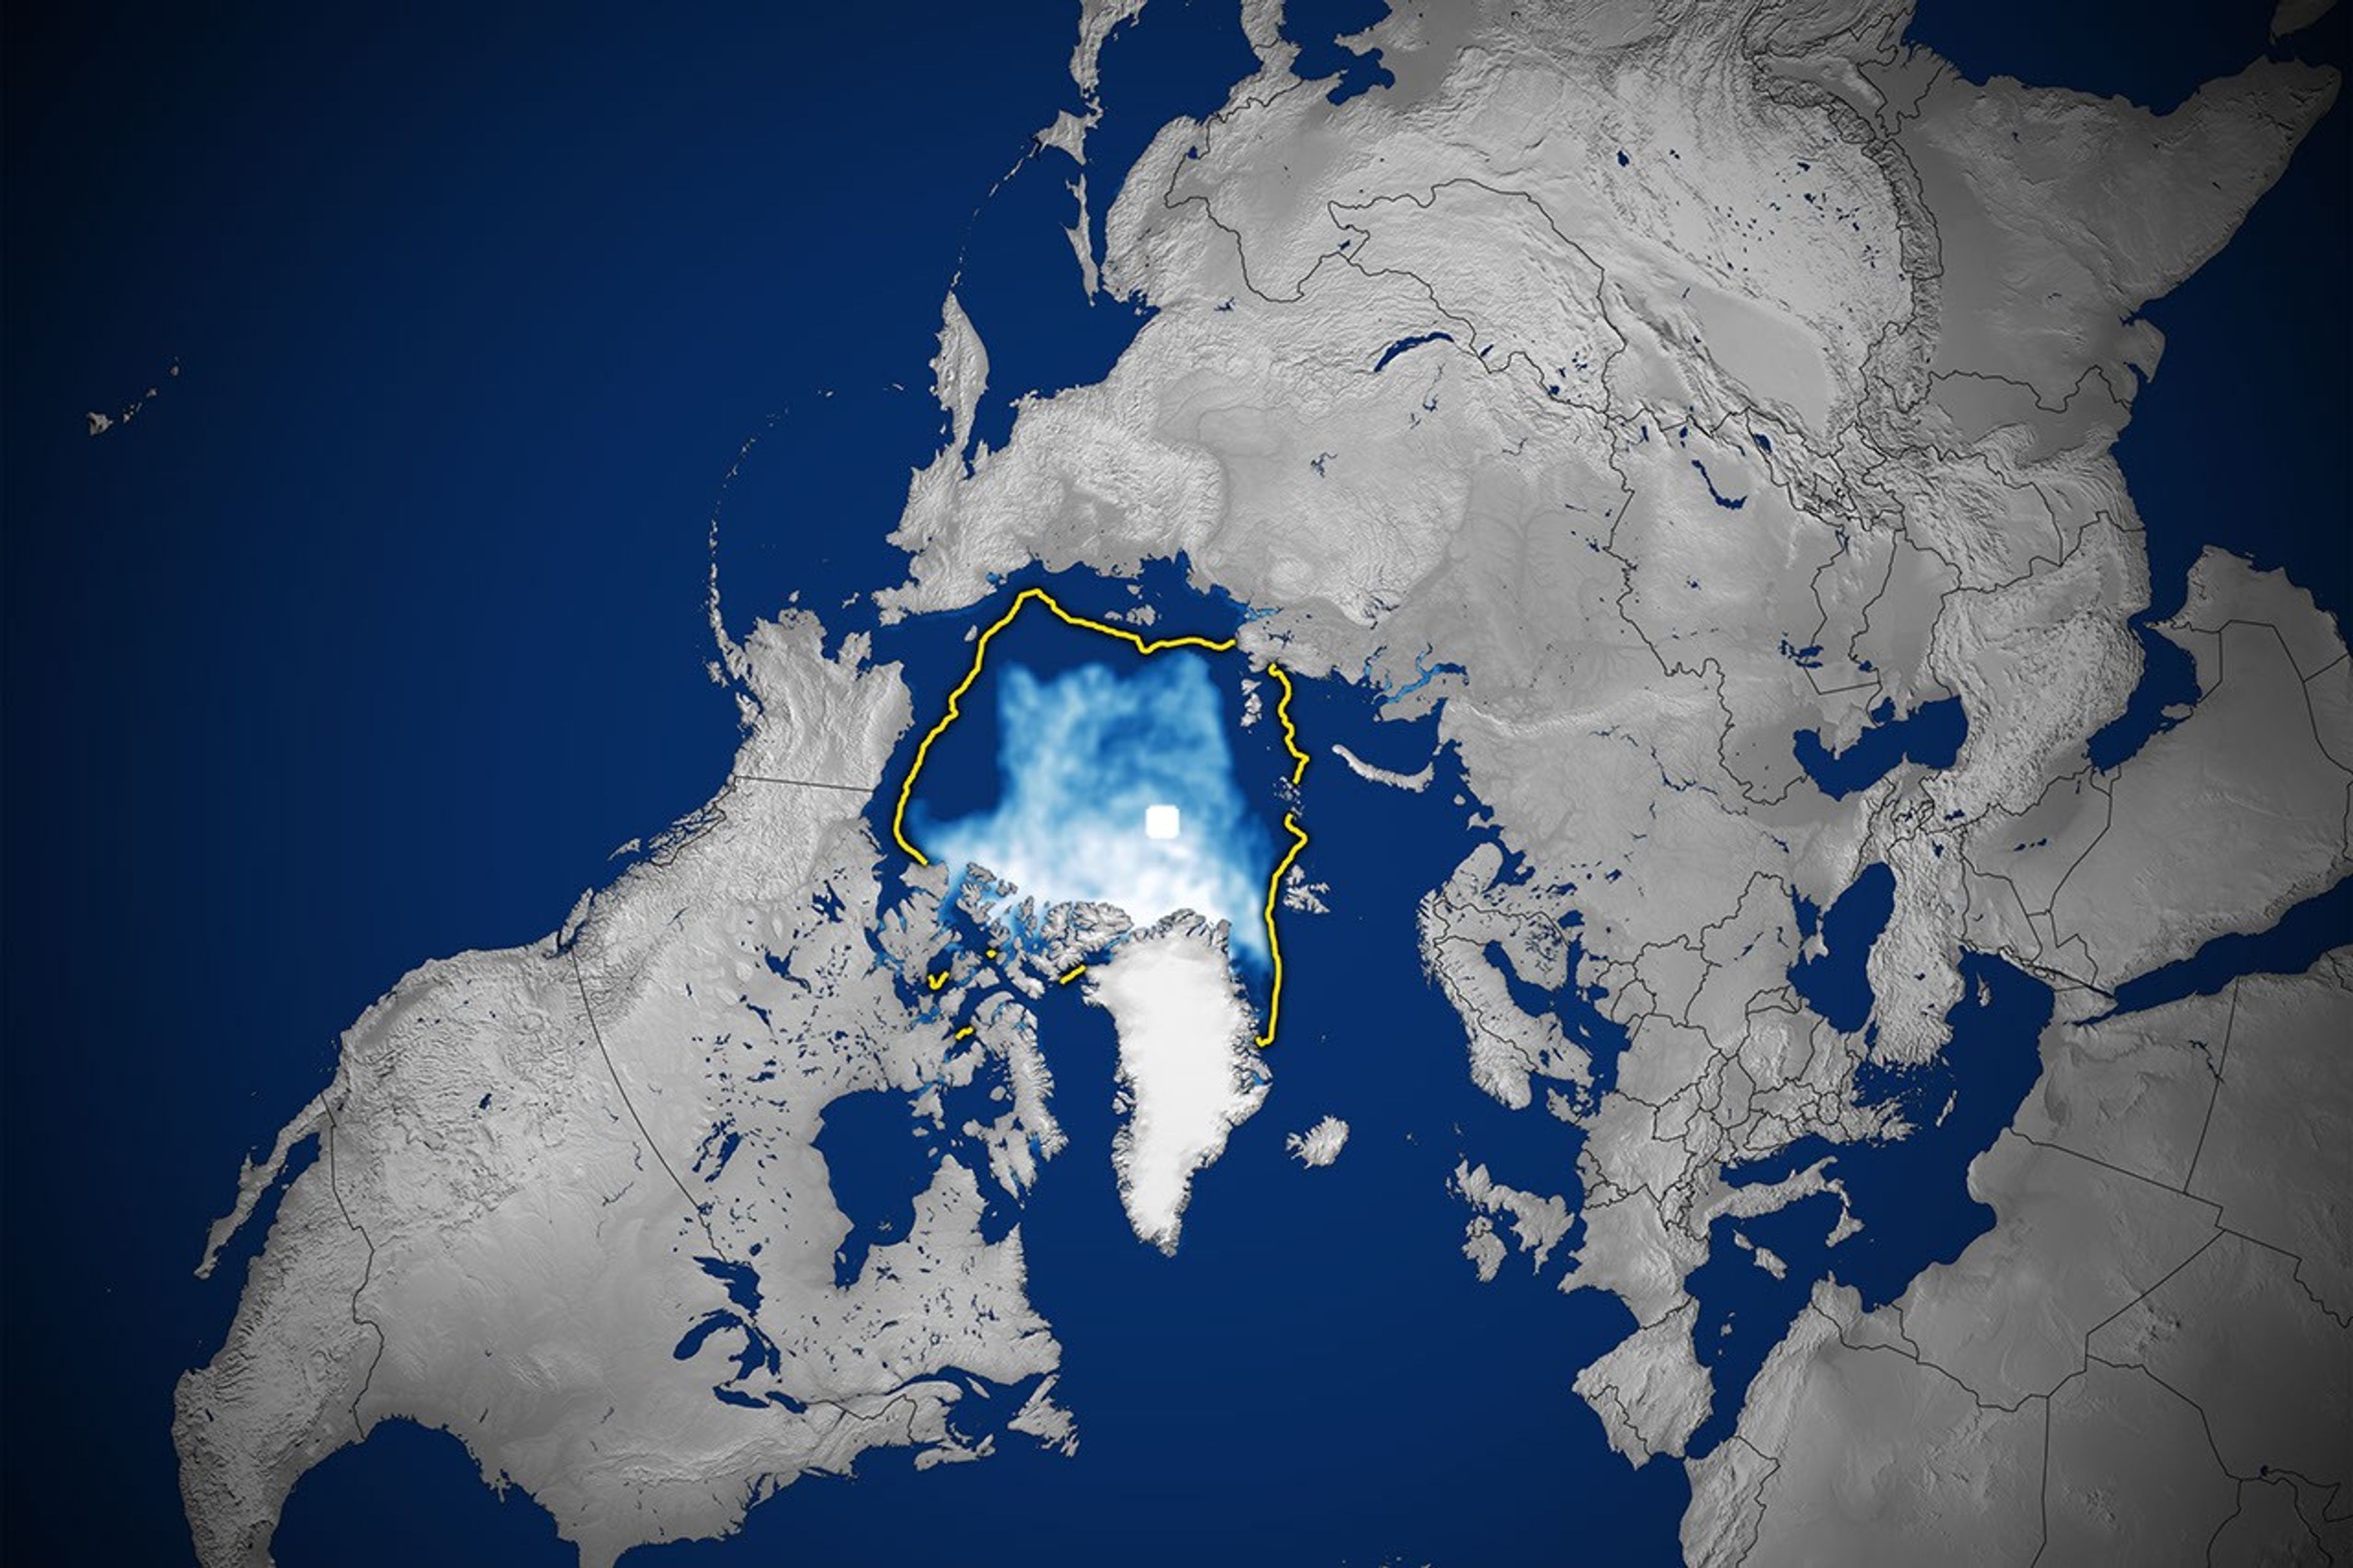
Sea ice in 2026 reached its annual minimum extent on September 12 (above), when it covered an estimated 4.6 million square kilometers (1.78 million square miles), according to NASA and the National Snow and Ice Data Center (NSIDC). That ties 2008, 2010, and 2025 for the 10th-lowest minimum in the satellite record.
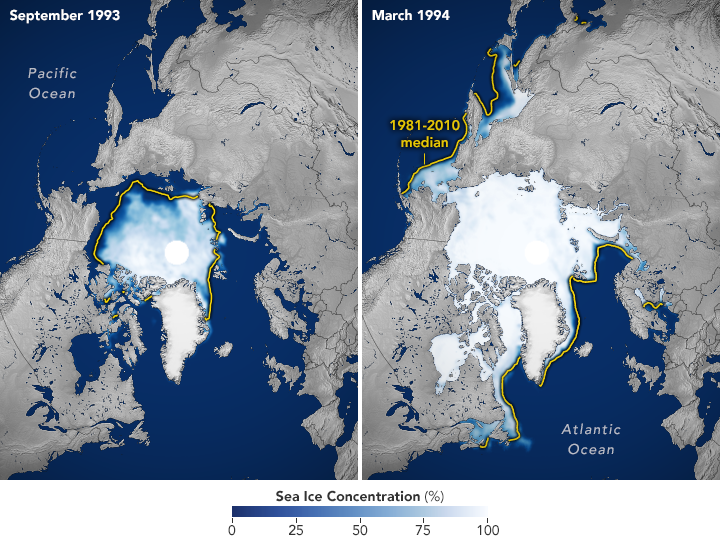
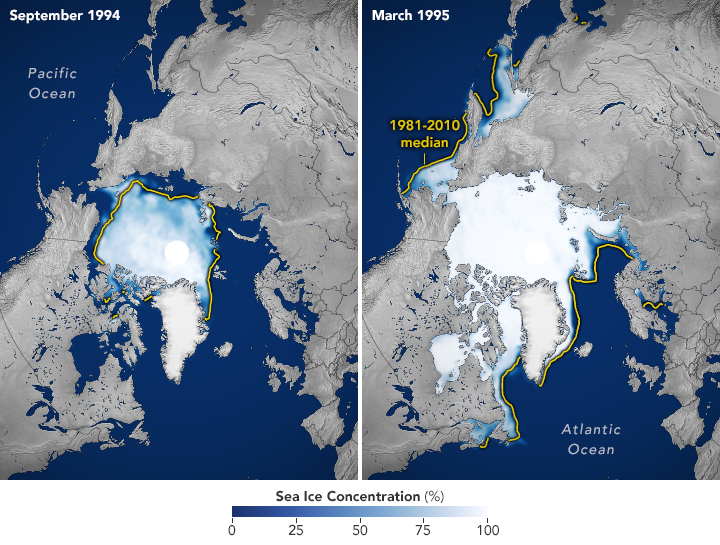
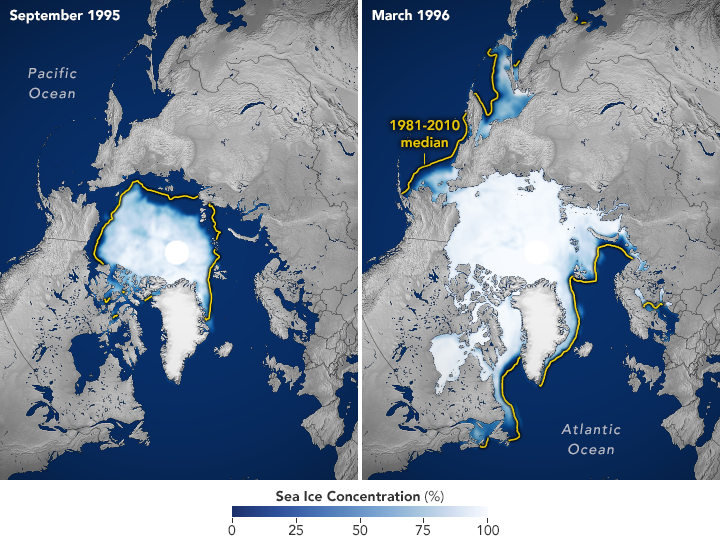
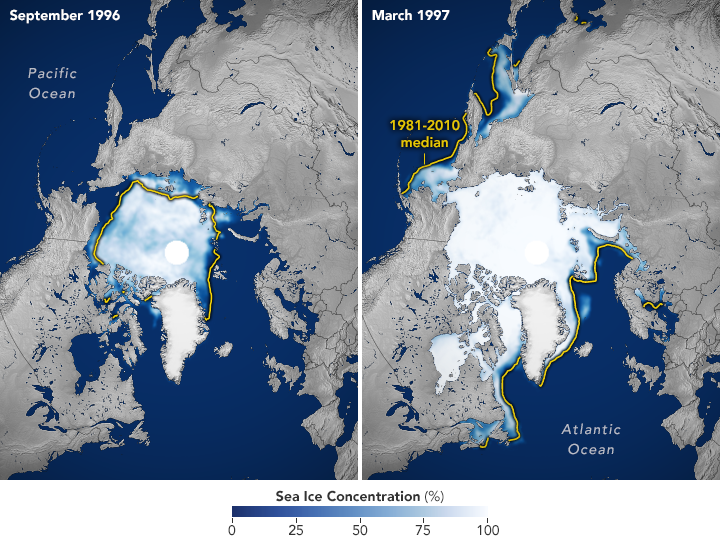
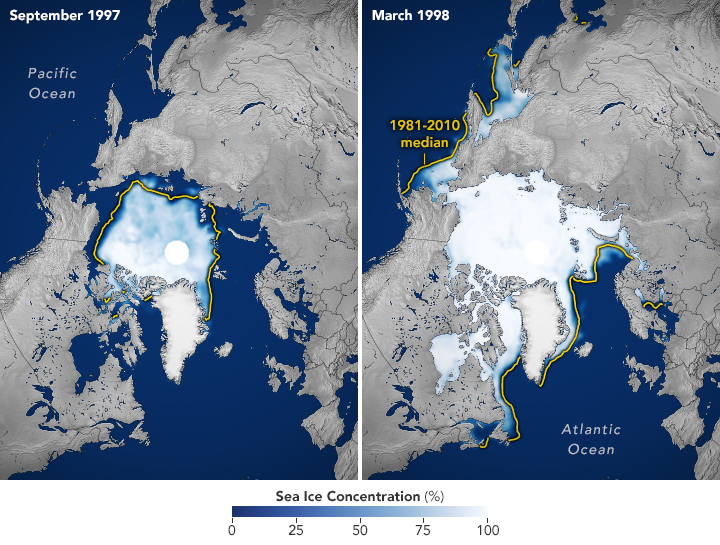
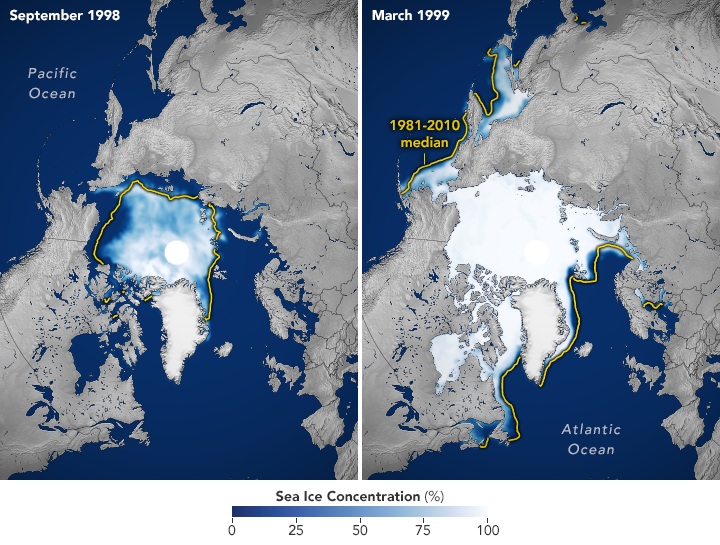
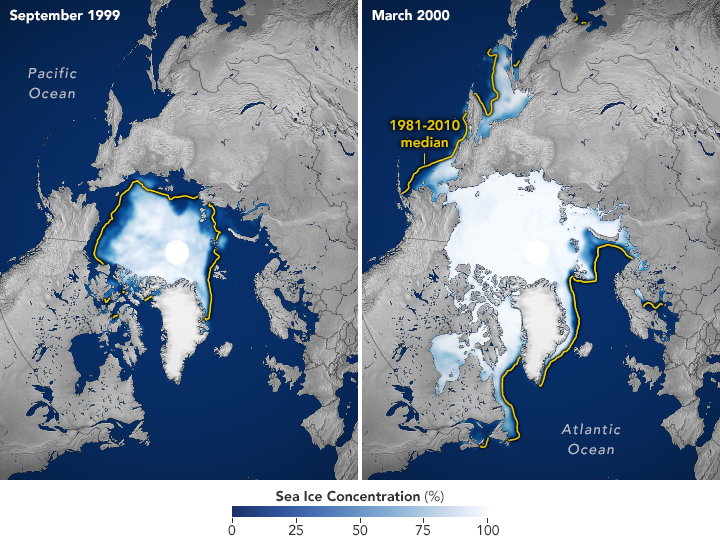
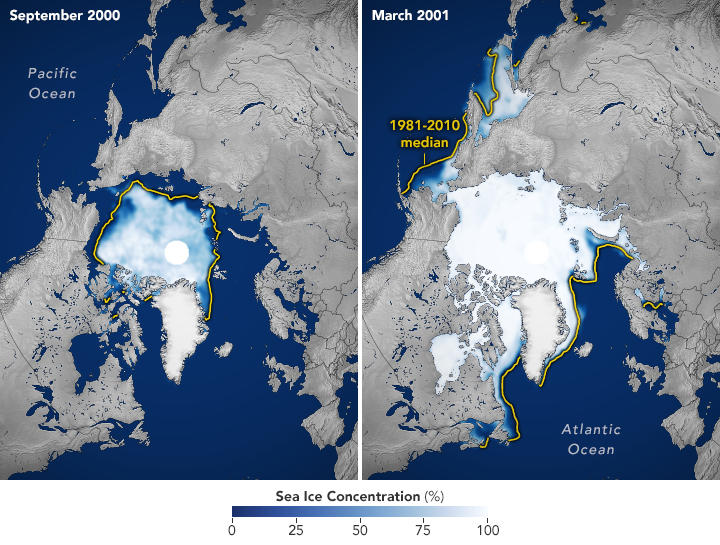
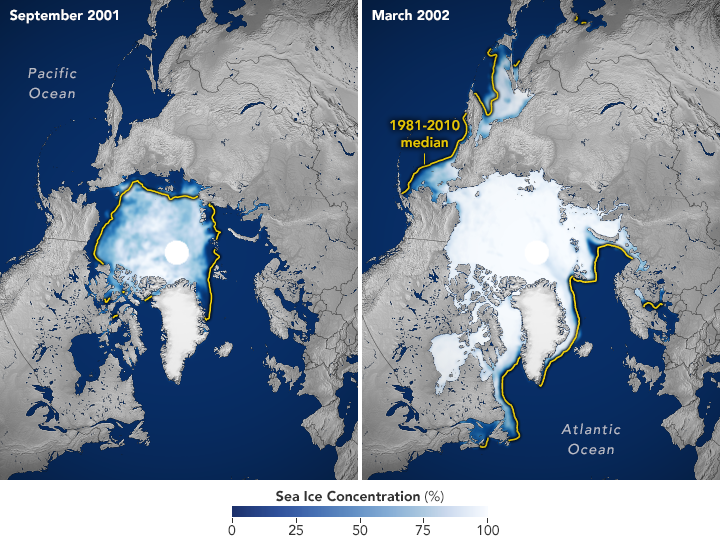
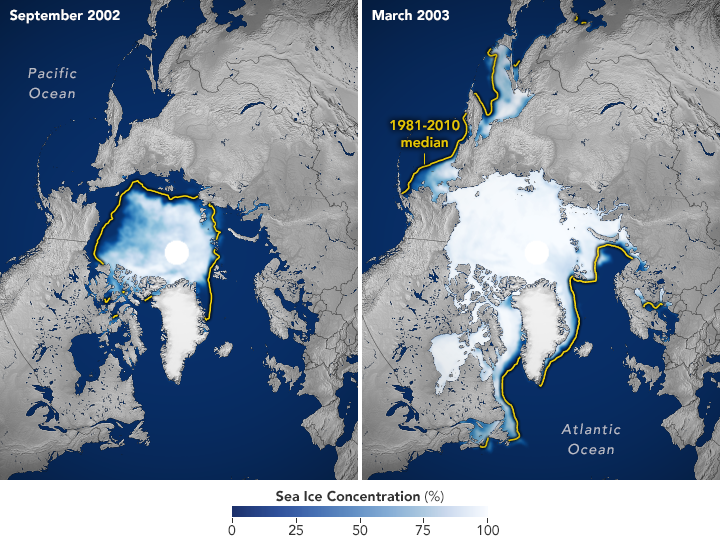
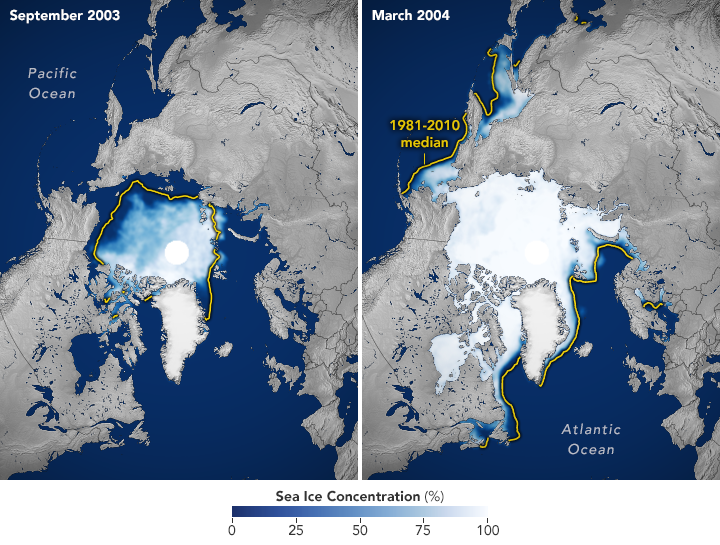
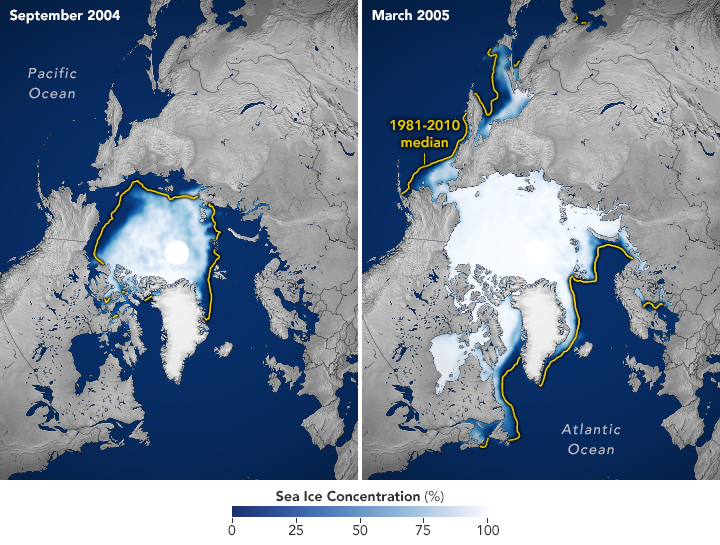
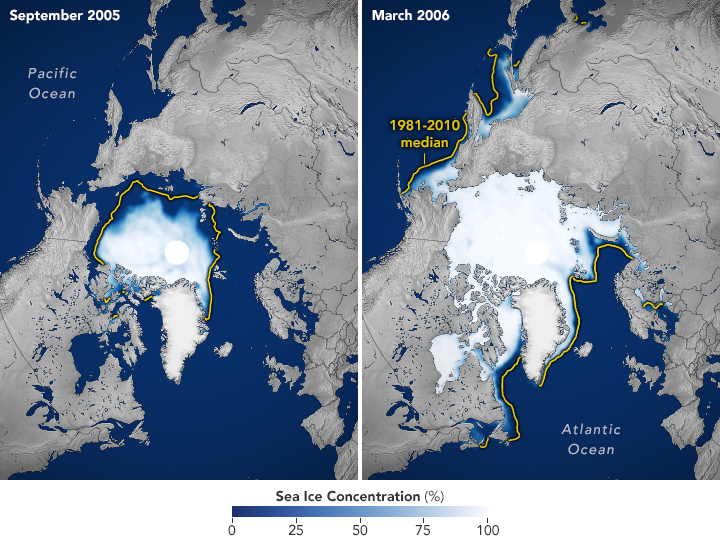
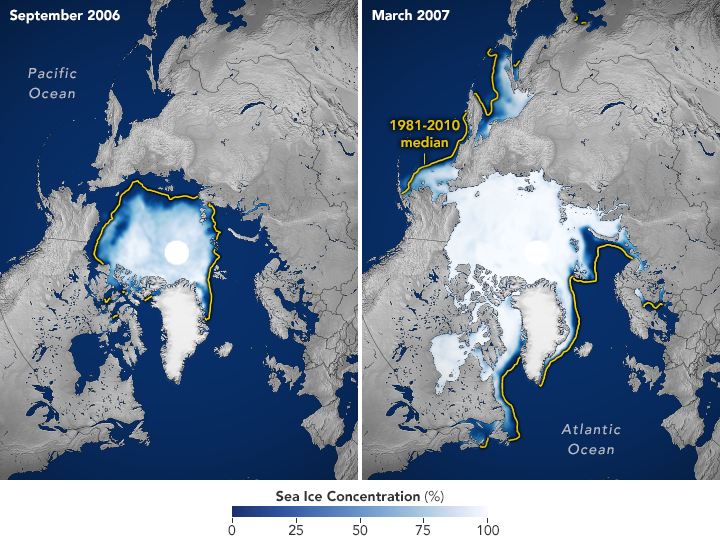
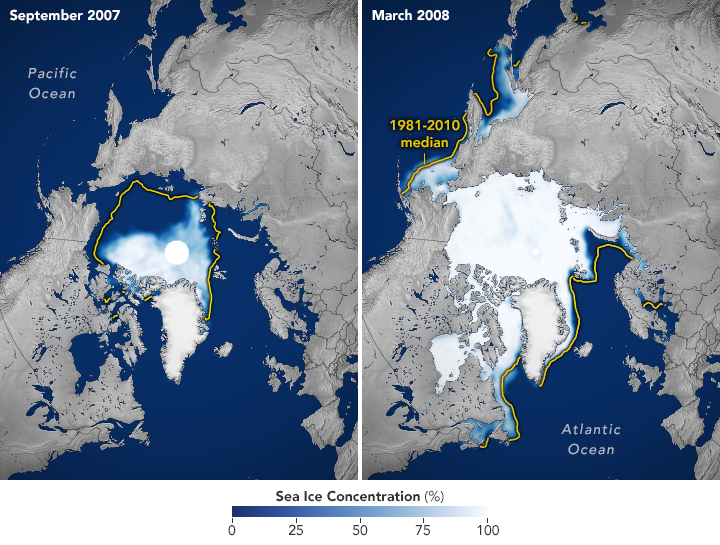
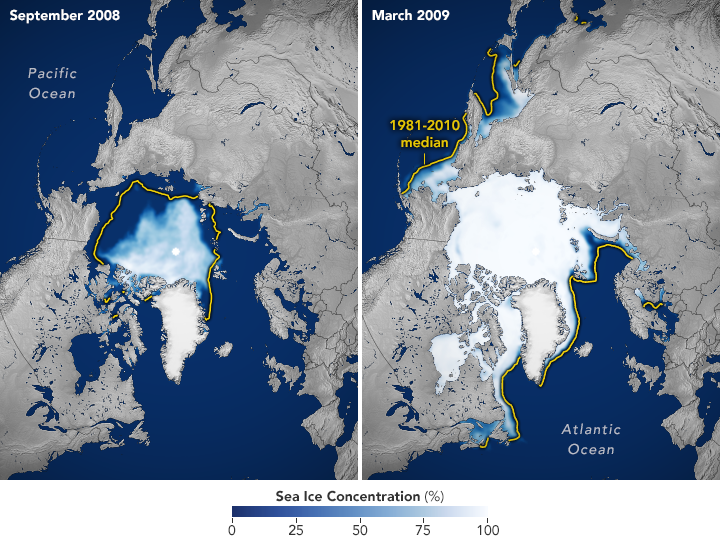
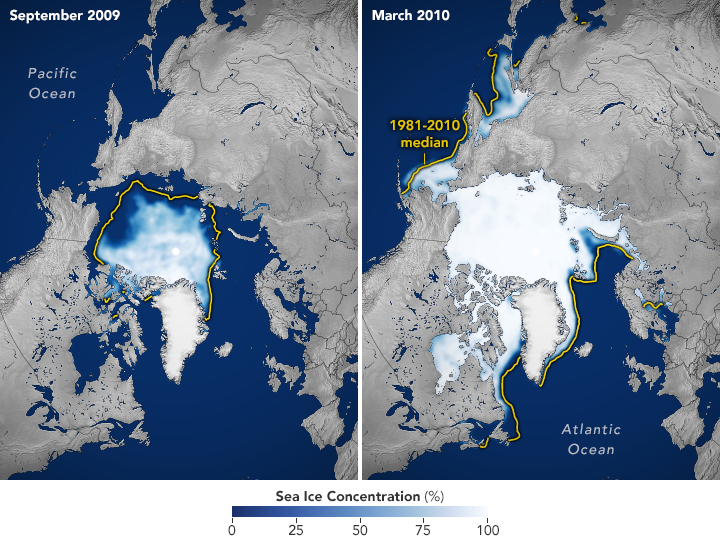
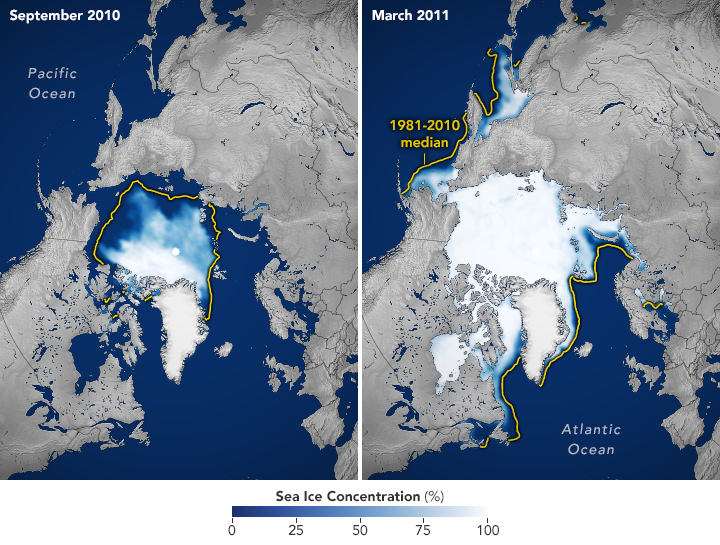
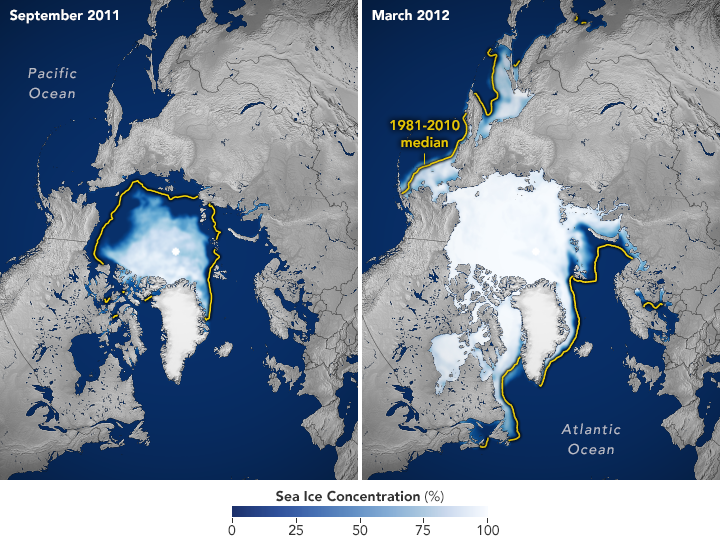
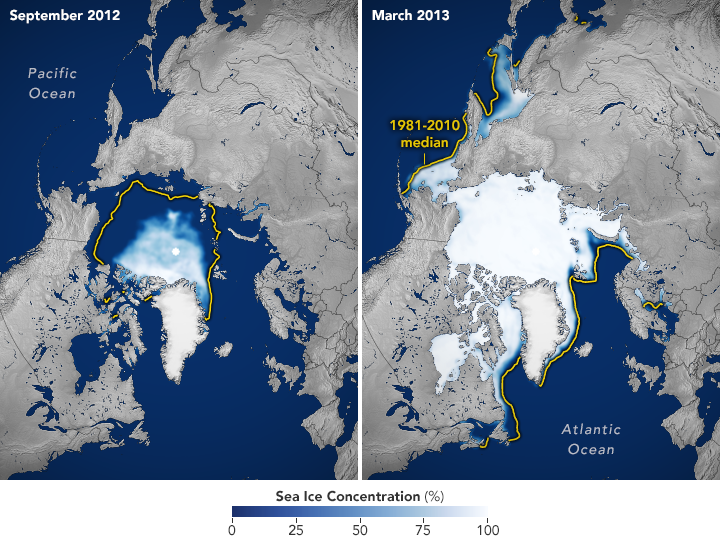
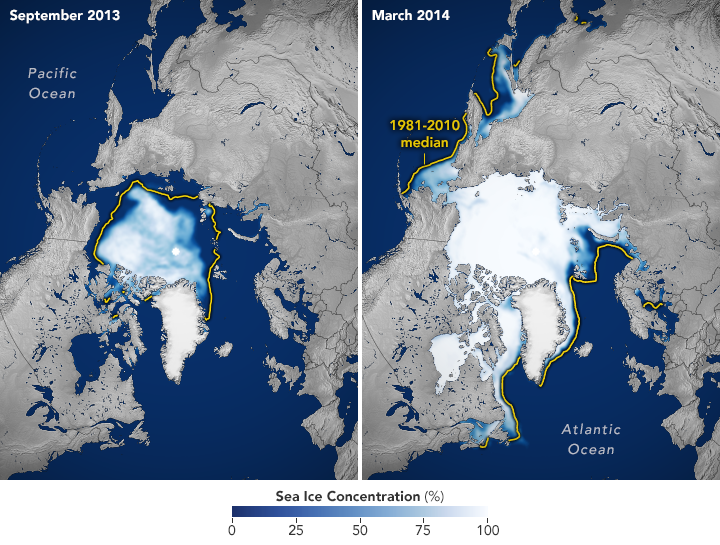
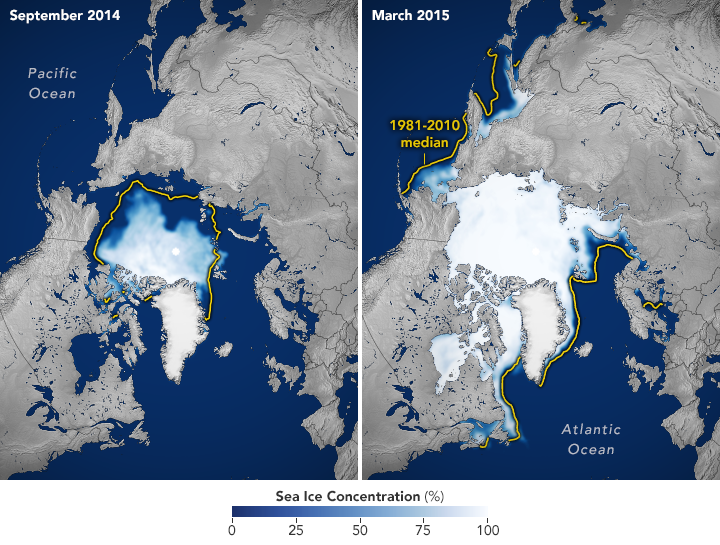
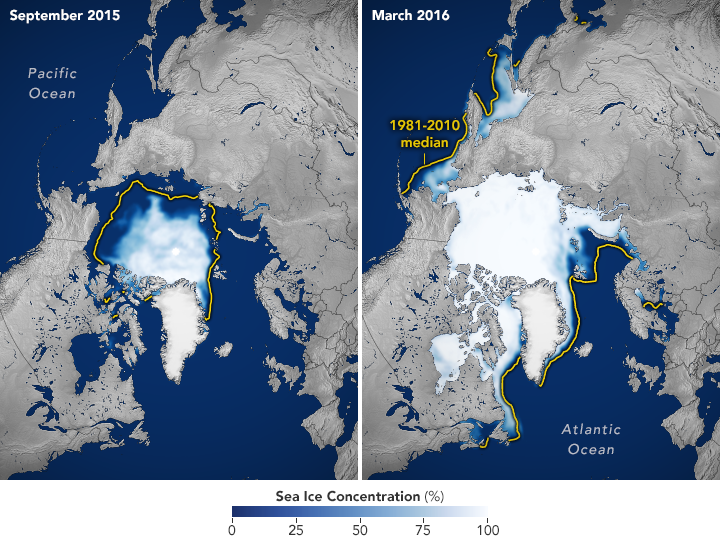
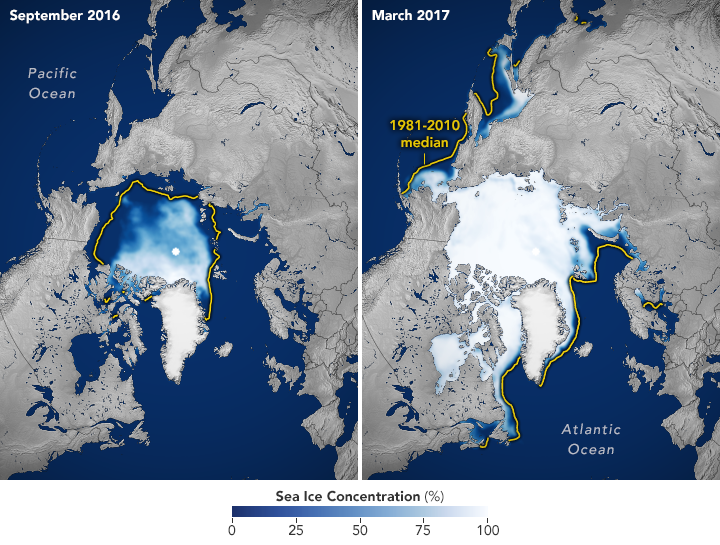
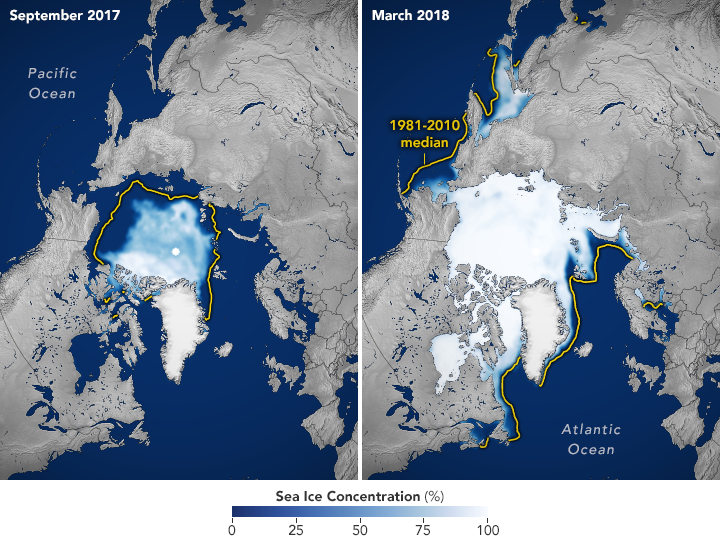
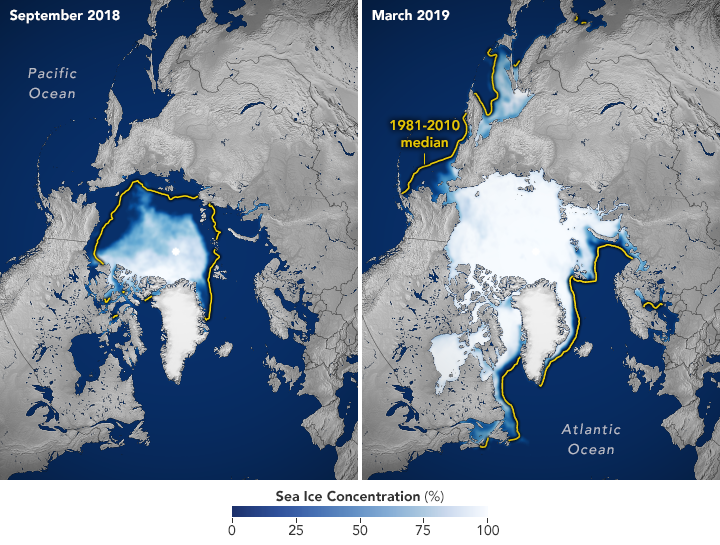
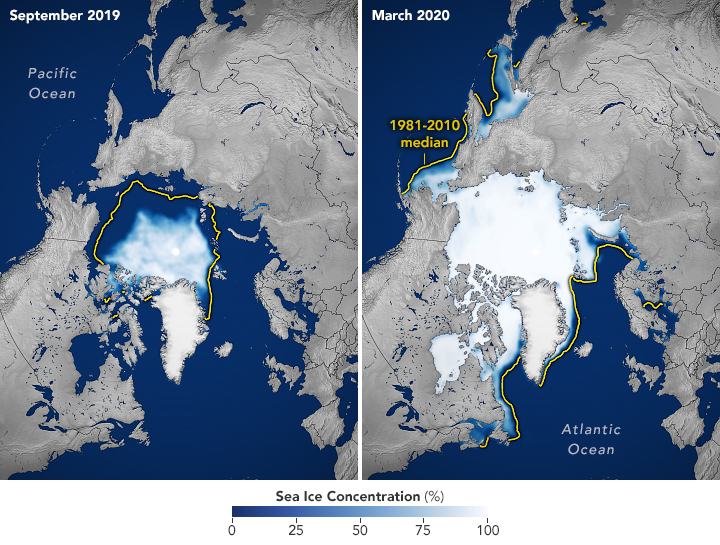
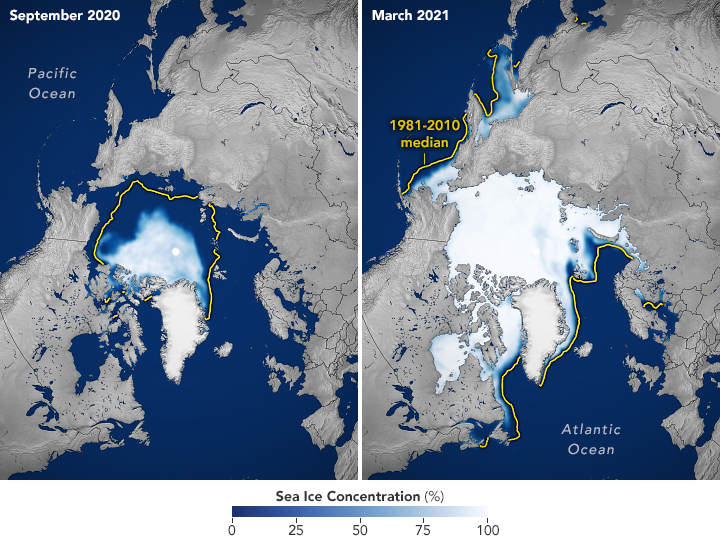
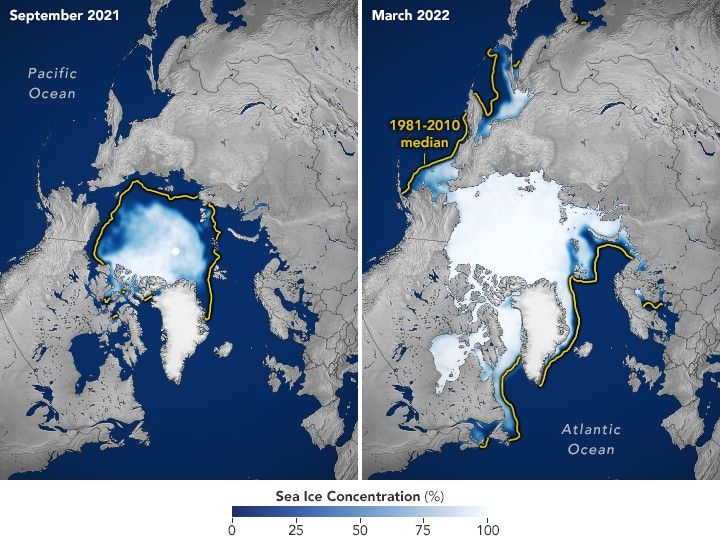
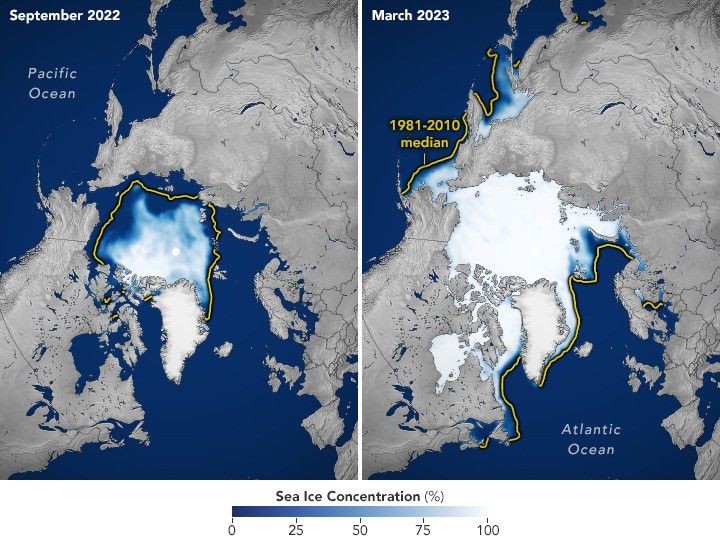
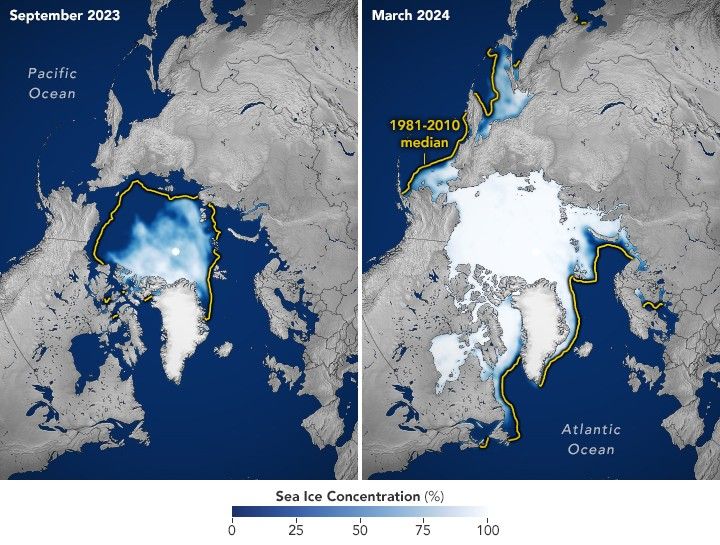
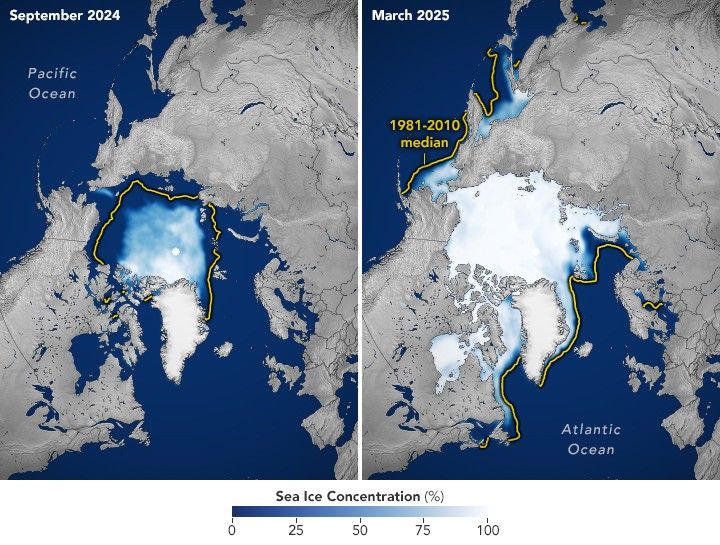
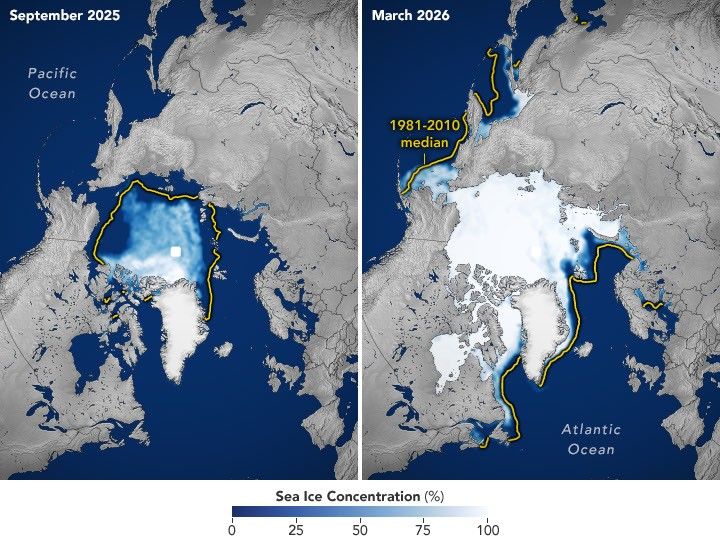
The maps below pair each September since 1990 (left), around the ice’s annual minimum, with the following March (right), near its annual maximum, through March 2026.
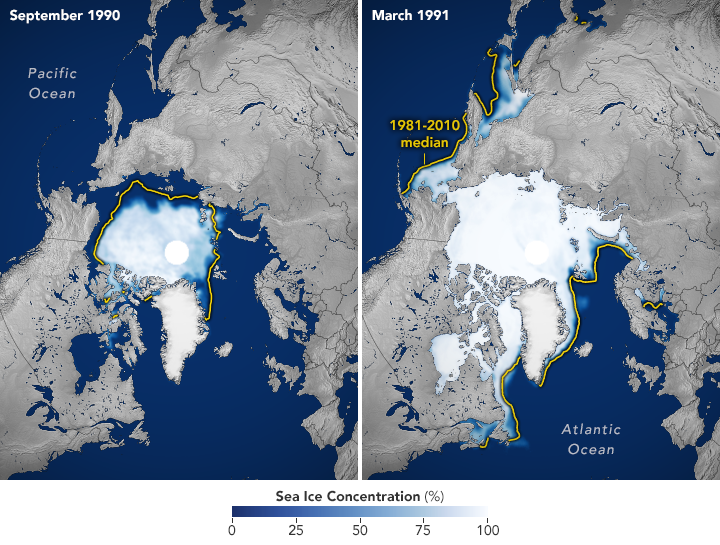
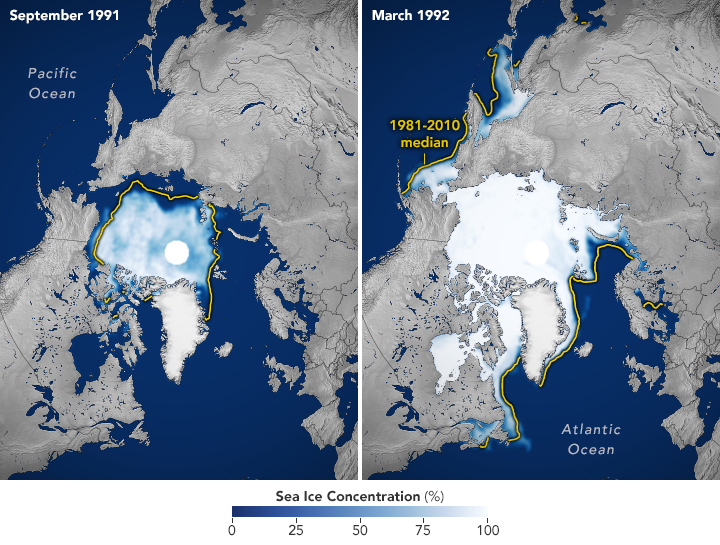
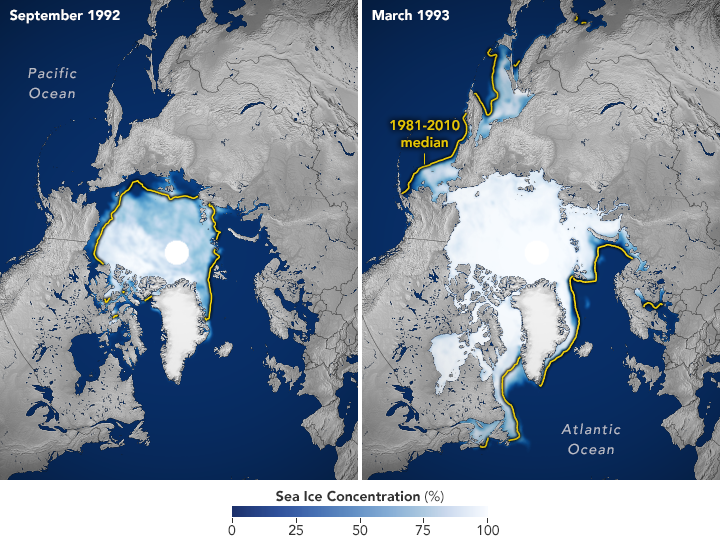
Lower Lows, Thinner Ice
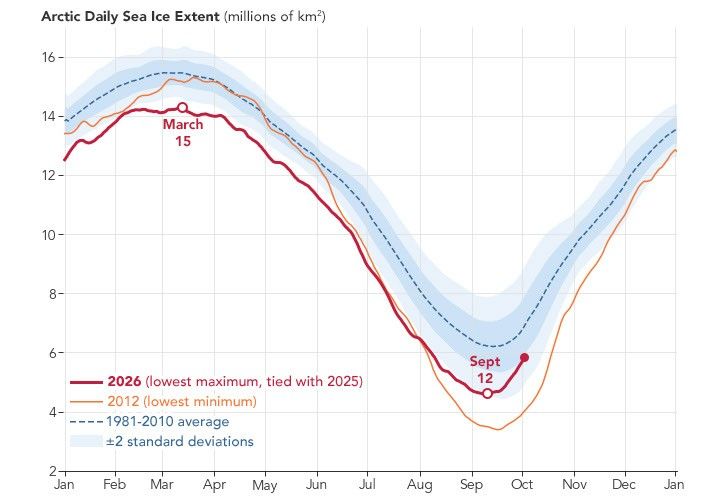
Scientists have used satellites to observe the annual growth and retreat of Arctic sea ice continuously since late 1978. While sea ice extent has declined overall during that time, the downward trend steepened in the 2000s and set off a run of record and near-record lows. Each of the past 20 summers, from 2007 through 2026, ranks among the 20 lowest minimum extents in the satellite record. The lowest occurred in September 2012.
More recently, the September sea ice extent has been relatively steady. Weather can make a big difference in how much ice melts from one summer to the next. For example, over the past decade, increased cloud cover has prevented sunlight from accelerating the melt, according to NASA scientists. Despite this recent plateau, the summer minimum remains well below the long-term average.
Across the Arctic, the ice that remains is younger and thinner. Observations show a decline in multiyear ice—that which survives at least one melt season—leaving an Arctic dominated by thinner first-year ice. Winter ice is also shrinking. The March 2026 maximum statistically tied the 2025 maximum for the lowest in the satellite record.
Cycles of natural variability such as the Arctic Oscillation are known to play a role in Arctic sea ice extent, but the decline observed throughout the satellite record cannot be explained by natural variability alone. Natural variability and rising global temperatures have worked together to melt greater amounts of Arctic sea ice. Scientists have projected an essentially ice-free Arctic could occur at least once before the middle of the 21st century.
Seeing Through the Clouds
To determine sea ice extent, scientists rely on satellites with passive microwave sensors that measure the microwave energy Earth naturally emits. Sea ice emits more of this energy than open water, so it stands out in microwave images. Because microwaves pass through clouds, the satellites can observe sea ice regularly, regardless of weather.
The record began in 1978 with data collected by NASA’s Nimbus-7, followed by Defense Meteorological Satellite Program (DMSP) satellites starting in 1987 and NASA’s Aqua satellite between 2002 and 2011. Starting in 2025, scientists began using observations from the Japan Aerospace Exploration Agency’s GCOM-W satellite. The white circle at the center of each image is the “pole hole,” north of which satellite sensors have historically been unable to collect data. The sea ice estimates assume that this hole is ice-filled.
NASA Earth Observatory images by Michala Garrison, using data from the National Snow and Ice Data Center.
References & Resources
- IPCC (2021) Summary for Policymakers. In: Climate Change 2021: The Physical Science Basis. Contribution of Working Group I to the Sixth Assessment Report of the Intergovernmental Panel on Climate Change. Accessed October 6, 2026.
- NASA Earthdata (2026, October) Sea Ice. Accessed October 6, 2026.
- NASA Earth Observatory (2026, October 6) World of Change: Arctic Sea Ice. Accessed October 6, 2026.
- NASA Earth Observatory (2016, September 16) Sea Ice. Accessed October 6, 2026.
- NASA Earth Science (2026, September 23) Arctic Sea Ice Reaches 2026 Annual Minimum Extent. Accessed October 6, 2026.
- National Snow and Ice Data Center (2026, September 23) Arctic sea ice minimum ties for tenth lowest. Accessed October 6, 2026.
- National Snow and Ice Data Center (2026, March 26) Arctic sea ice record low maximum strikes again. Accessed October 6, 2026.
You may also be interested in:
Stay up-to-date with the latest content from NASA as we explore the universe and discover more about our home planet.
While the sea ice melt season has lengthened dramatically in most of the satellite era, the trend unexpectedly stabilized around…

Experts are analyzing decades of images from Landsat satellites for clues about how the iconic birds have responded to sea…

The color of Adélie penguin droppings reveals what the birds are eating, offering scientists a way to track how sea…
Discover More from NASA Earth Science
Subscribe to Earth Observatory Newsletters
Subscribe to the Earth Observatory and get the Earth in your inbox.

Earth Observatory Image of the Day
NASA’s Earth Observatory brings you the Earth, every day, with in-depth stories and stunning imagery.

Explore Earth Science

Earth Science Data
Open access to NASA’s archive of Earth science data